Soundscape Analysis, Metrics, and Tools
Project 1: Soundscape metric processing and archiving
Team Leads
Samara Haver (PMEL), Megan McKenna (ONMS)
Goal
Facilitate cross-agency, region, and platform soundscape comparisons by quantifying soundscape metrics for priority datasets and generate decision support tools that integrate soundscape visualizations with multiple data types.
Target outcome
Identify, archive, and process soundscape metrics for priority SI PAM datasets to build capacity and consistency across programs.
Summary
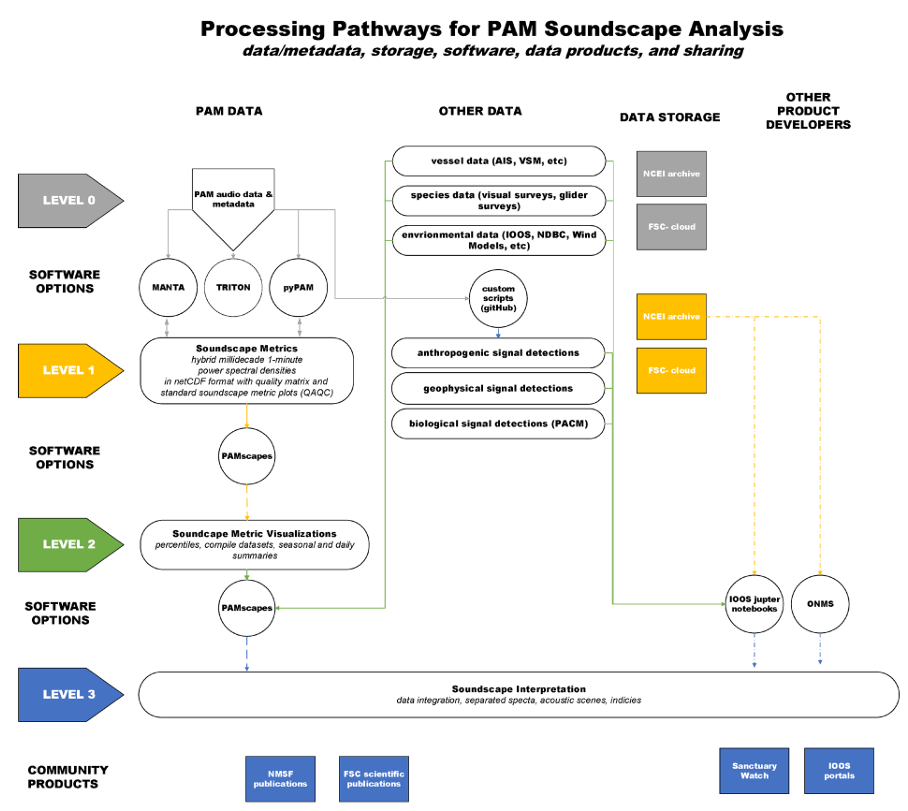
This project will add soundscape metrics for priority PAM SI datasets alongside audio files and other metrics to the NCEI Passive Acoustics archive. The soundscape metrics will be used to develop and demonstrate soundscape interpretation and visualization tools being developed as part of the SI. The datasets will also facilitate comparison of data sampled by multiple recording technologies and projects that are unique to select FMCs. A technical guide for processing and archiving PAM data will also be prepared as part of this project. This project will work with PAM SI cloud computing projects to operationalize soundscape metric processing software in the cloud environment. Streamlining and documenting methods to process and archive soundscape metrics supports PAM SI objectives to advance PAM data analysis and integration approaches, and advance archival cloud capabilities.
Action items
Convene working group: Establish data processing group, Google doc folder, regular check-in schedule.
Identify priority datasets: In coordination with Carrie Wall Bell and NCEI Archiving group decide on soundscape priority datasets for each FMC and flag in the overall PAM SI priority dataset table.
Prepare analyses: For priority soundscape datasets: Prepare metadata, share QA/QC protocol/tools, prepare and submit audio data and soundscape metrics (if already processed locally) to NCEI for archiving.
Test in pyPAM: Coordinate with PAM SI Cloud team to test pyPAM cloud processing from NCEI GCP on priority NRS audio data sets.
Establish software standards: Identify standard software options available for use and test Noise Reference Station (NRS) dataset results from multiple software outputs.
Compare soundscape software options: Provide soundscape software options available (MANTA, pyPAM, updated Triton toolbox, etc.) with comparison documentation for example datasets (NRS or others if necessary).
Generate Hybrid Milli-Decade (HMD) output: FMCs will conduct HMD processing either locally or through the PAM SI Cloud computing and save to NCEI or internal PAM SI cloud environment.
NCEI archive data products: All HMD outputs will be processed and sent to NCEI archive for level 2-3 data products.
Facilitate more complex soundscape analyses: All priority soundscape datasets and HMD level 1 products will be cloud archived at NCEI for use in the Soundscape interpretation and visualization project.
Create supporting documents: Develop technical reports and tutorial videos for HMD metric processing, minimum QA/QC, and visualization routines developed in coordination with SoundCoop efforts, and PyPAM and PAMscapes software development efforts.
Support comparison across platforms: Comparison of soundscape metric results from simultaneously co-deployed platforms; develop tools to support this type of comparison (ie. PAMscapes). The data processing groups will establish methods for comparison, ongoing opportunistic evaluation will occur throughout the SI, and results will be added to the GitHub Soundscape Group and reported with example datasets. For SoundTrap comparisons, SoundTrap models will be specified at the time of comparison.
Support comparison across datasets with known differences: Develop a format or tool to support comparison of datasets with known differences, such as perfect timing (MARS), dropped time (SoundTrap), duty cycled (AKFSC, NWFSC), frequency-dependent calibration (NRS, HARP), file format (XWAV).
Project 2: Soundscape metric interpretation and visualization
Team leads
Samara Haver (PMEL), Megan McKenna (ONMS), Becca Van Hoeck (NEFSC), Marla Holt (NWFSC)
Target outcome
Create a set of soundscape metric interpretation open-source processing pathways and visualizations for cross-FMCs comparisons and FMCs-specific soundscape priorities.
Summary
This project will build on existing tools in PAMscapes (R/CRAN) to create and document processing pathways for soundscape metric interpretation. NOAA Noise Reference Station soundscape metrics will be used to build the pathways and evaluate outputs. Additional soundscape metrics from PAM SI priority data sets will be incorporated based on availability from priority project #1 for soundscapes. This priority supports PAM SI objective #2 by creating decision-support tools that are relevant at regional and national scales. It also supports #4 by integrating PAM data with variables to provide context for different soundscapes (environmental data, species-detections, etc).
Action items
Establish working group: Establish working group and create folder in shared Google doc folder.
Identify datasets: Decide on priority Noise Reference Station (NRS) datasets for metric development.
Data products to NCEI: NRS Hybrid Milli-Decade (HMD) products to be included in initial comparison sent to NCEI.
Identify visualization options: Organize and expand on options for HMD data visualizations as originally prepared for PAMscapes, share with working group via Google doc folder for discussion of level 1 visualization goals. Ideas and inspiration will be organized for project team brainstorming and feedback meeting.
Develop workplan: Set-up work plan with Taiki Sakai to evaluate HMD QA/QC with visualizations in PAMscapes including level 1 visualizations such as percentiles, LTSA, and bringing together MANTA and pyPAM default outputs.
Present initial results: Updated PAMscapes tool for HMD QA/QC level 1 visualization will be shared with project team for feedback and further development.
Level 2 data product planning: In coordination with QA/QC tool development, and informed by ongoing collaboration with SoundCoop partners, the Soundscape group will develop level 2 visualization for HMD output by: integrating environmental data (currents, wind, ice, etc.) and time/frequency bins for quantitative visualization (e.g., SPD). The option to integrate these visualizations as additional PAMscapes functionality or publish as separate code on GitHub will be evaluated.
Level 3 data product planning: Plan the development level 3 products from HMD that prioritize and reflect the needs of SI and FMCs including: integration with PACM; noise budgets; sound propagation; automated soundscape analysis; co-variate for species models; categorization from HMD data; repository of labeled HMD data; integration of AIS data.
Cloud processing: Following Cloud Computing project Phase 7 (Software phase II validation), conduct cloud processing for HMD and PAMscapes to apply relevant methods on FMCs priority datasets.
Facilitate national comparisons: Develop additional products or visualizations for nationwide comparison of FMC priority soundscapes.
Present project outcomes: Present tested and functional cloud processing routines for level 1-3 products for all priority data sets for PAM SI reporting and additional science needs.